Nitrogen Loading
Nutrient Loading
How much nitrogen is coming into the Great Bay Estuary and how has loading changed over time?
Estimated annual total nitrogen load from 2017 to 2020 averaged 895 U.S. tons, which is similar to the 2012 to 2016 average (903 tons per year), but lower than the high point from the mid-2000s. Comparing 2012 to 2020, there was a 64% decrease in overall point source nitrogen loading from wastewater treatment facilities. This resulted directly from the actions of several municipalities to make substantial improvements to their wastewater treatment facilities to reduce the amount of nitrogen they discharge. Non-point source nitrogen loading — nitrogen from diffuse sources that are difficult to pinpoint — in 2017 to 2020 averaged 699 tons per year, which is 15% higher than the 2012 to 2016 average (607 tons per year). Nitrogen loading data for Hampton-Seabrook Estuary are currently being developed and will be reported in future documents.
Estimated annual total nitrogen load from 2017 to 2020 averaged 895 tons, which is similar to the 2012 to 2016 average (903 tons per year), but lower than the high point from the mid-2000s (Figure 7.1). In 2020, the most recent year that we have estimates for, the average annual load was 627 tons, which is the lowest on record. Figure 7.1 indicates a trend in nitrogen reductions, especially compared with the 2005 – 2007 period, when nitrogen loading peaked.
However, nitrogen loading remains higher than the amount recommended by the EPA in the Great Bay Total Nitrogen General Permit, issued in 2021. To meet that long-term goal, nitrogen loading would have to be further reduced by approximately 39% from the 2020 level. While reduction efforts continue, it is acknowledged that the goal in the permit is subject to change based on active research into the relationship between nitrogen loading and adverse effects on the ecosystem, such as seaweed blooms and loss of eelgrass. Results of this research could lead to adjustments (up or down) in the loading goal.
Figure 7.1 indicates a great deal of variation over the time series. This variation should be looked at in the context of the two types of loading: from point sources versus non-point sources. Point sources of nitrogen are predominantly from wastewater treatment facilities, while non-point source nitrogen enters into our streams, rivers, and estuaries in three main ways: 1) from stormwater runoff, which includes nitrogen from atmospheric deposition (including transportation and industrial emissions), fertilizers, and animal waste; 2) from groundwater contribution, which carries nitrogen from septic systems, sewer leakage, infiltrated fertilizers, and animal waste;26,27 and 3) from direct atmospheric deposition.
Between 2003 and 2011, most of the variability in nitrogen loading was related to non-point source inputs, while the contribution from point source inputs was relatively stable during that period (Figure 7.1). The highest loads since 2003 were in the 2005 to 2007 period (1,662 tons per year), a time that coincides with the highest total annual precipitation. In comparison, the lower rainfall during 2012 to 2020 contributed to the lower total and non-point source loading during this period.
Non-point sources of nitrogen in 2017 to 2020 accounted for 78% (Figure 7.2) of the total nitrogen load. During the fall seasons of 2016 and 2020, most of the watershed experienced extreme drought conditions.28 This underscores the association between nitrogen loading and stormwater run-off. Precipitation records and forecasts29 suggest that our region will continue to see periods of extreme high and low precipitation, which will continue to impact non-point source nitrogen loads.
In terms of point sources, the 17 municipal wastewater treatment facilities accounted for 22% of the total nitrogen load in 2017 to 2020 (Figure 7.2). The 2017 to 2020 point-source loads were lower than in any other reporting period since 2003 despite increased population. This is a result of substantial investment in upgraded wastewater treatment by several municipalities in the watershed to reduce the amount of total nitrogen they discharge. There has been a 64% decrease in overall point source nitrogen loading from wastewater treatment facilities between 2012 and 2020.
Total nitrogen load includes dissolved inorganic nitrogen, dissolved organic nitrogen, and particulate nitrogen (PN). Of the 895 tons of nitrogen entering the bay annually (on average) from 2017 – 2020, 50% (444 tons per year) was dissolved inorganic nitrogen, which is comprised of the most biologically available forms of nitrogen. The 2017 to 2020 dissolved inorganic nitrogen load was 12% lower than the average dissolved inorganic nitrogen load in 2012 to 2016 (506 tons per year). In earlier reporting periods, point source and non-point source dissolved inorganic nitrogen each accounted for approximately half of the dissolved inorganic nitrogen load (Figure 7.3). In 2017 to 2020, 34% of the DIN load was point source and 66% was non-point source (Figure 7.3). This reduction in point-source dissolved inorganic nitrogen loading could reduce the excessive biological activity of problematic seaweeds in Little Bay and Great Bay given that seaweeds generally uptake dissolved inorganic nitrogen preferentially over organic nitrogen.
Acknowledgments and Credit
Michelle D. Shattuck (UNH), with contributions from Aneliya Cox (UNH), Miguel Leon (UNH), and Kalle Matso (PREP).
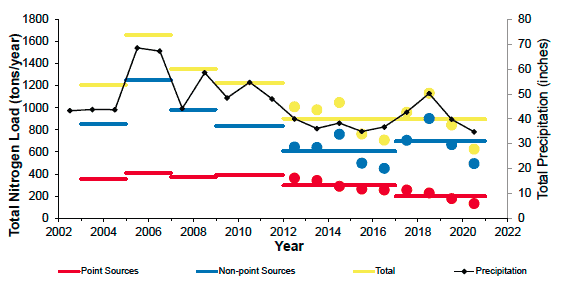
Figure 7.1: Nitrogen loads to the Great Bay Estuary, shown separated by source as well as the combined total nitrogen load. Loads are based on an estuarine surface area of 13.4 square miles. (Lower Piscataqua River not included. See the Extended Report for details.) Colored circles indicate annual loads for 2012 through 2020. Annualized data were not available for 2003 – 2011, thus multi-year averages are presented for the entire record. Precipitation data are from the Portsmouth (Pease/KPSM) weather station.
Data sources: EPA, Municipalities, USGS, PREP, and Water Quality Analysis Lab (WQAL)
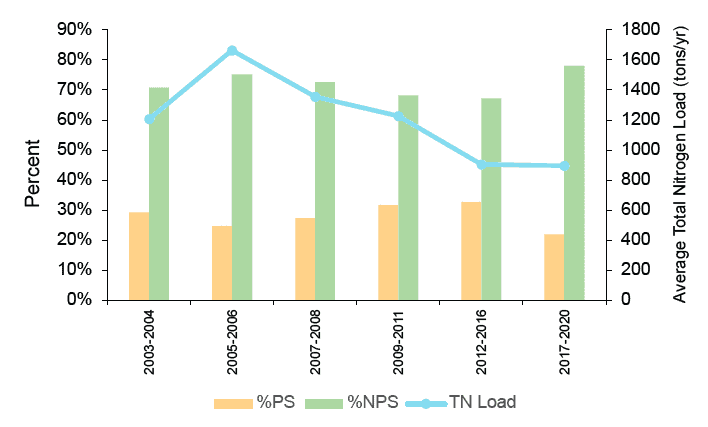
Figure 7.2: Estimated average for total nitrogen (TN) loads to the Great Bay Estuary point sources (PS) and non-point
sources (NPS). Loads are based on an estuarine surface area of 13.4 square miles. (Lower Piscataqua River not included. See the Extended Report for details.) PS and NPS values for each time period amount to 100% of total loading.
Data sources: See the Extended Report
for nutrient loading
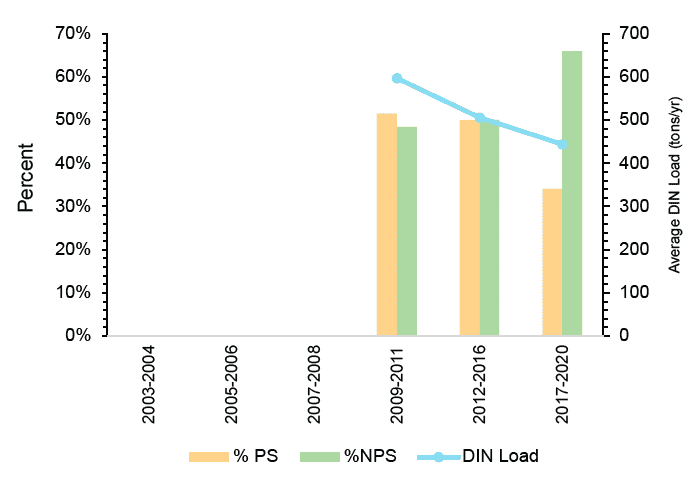
Figure 7.3: Estimated average for dissolved inorganic nitrogen (DIN) loads to the Great Bay Estuary from point sources (PS and non-point sources (NPS). Loads are based on an estuarine surface area of 13.4 square miles. (Lower Piscataqua River not included. See the Extended Report for details.) PS and NPS values for each time period amount to 100% of total loading. DIN loads were not
available for 2003 – 2008.
Data sources: See the Extended Report
for nutrient loading
Nitrogen Loading – Extended Report
Includes methods, data, and additional discussion not included in the Printed Edition.